

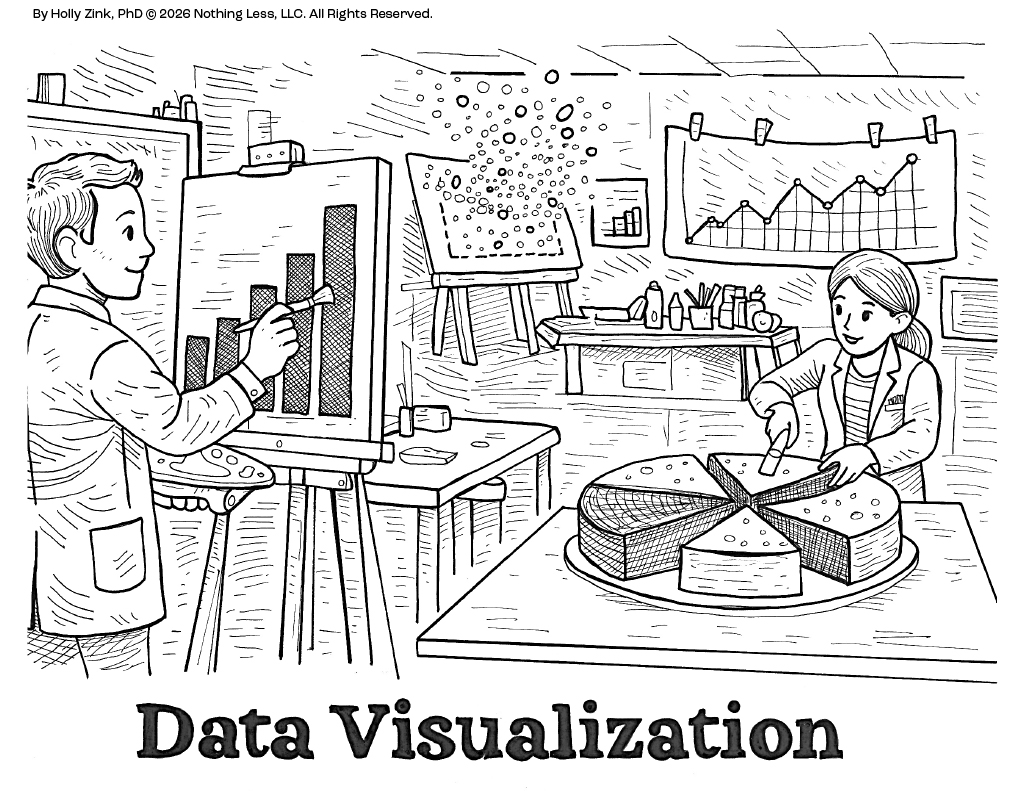
This week’s Science Gets Literal illustration explores Data Visualization.
The literal version shows a scientist standing before an easel, painting graphs, charts, and figures as if creating a work of art.
At first glance, the comparison seems playful. Yet data visualization has always contained a creative dimension.
Researchers generate enormous amounts of information, but raw numbers alone rarely tell a story. Visualization allows patterns to emerge. Trends become visible. Relationships that once seemed hidden suddenly become understandable.
Good visualizations are not simply decorative. They serve as tools for thinking.
Some of the most influential scientific figures in history transformed entire fields not by collecting new information, but by finding better ways to represent existing information. The right image can reveal insights that remain invisible in a spreadsheet.
Science and creativity are often portrayed as separate worlds. In reality, they frequently work together.
Visualization reminds us that discovery is not only about finding knowledge. It is also about helping others see it.
Science Gets Literal is an ongoing illustration series that explores scientific concepts through visual wordplay. Each piece begins with a familiar scientific term and asks a simple question: “What if we took that phrase literally?” My hope is that these drawings remind us that curiosity, creativity, and joy remain essential parts of discovery.


